Greta Krüger · 22 September 2026
Mapping the Growth of Shoreline Hospitality Through Archival Photographs and Local Records
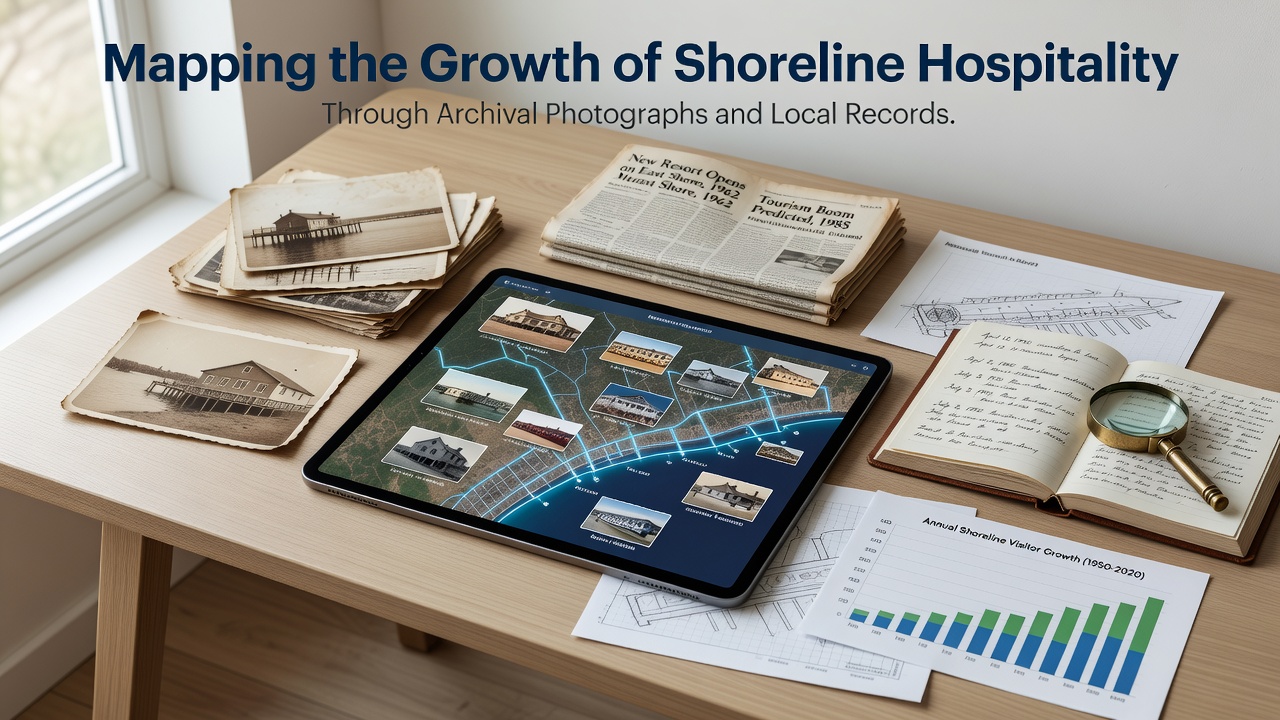
Historians and archivists track the expansion of shoreline hospitality by combining sequences of old photographs with property deeds, business licenses, and municipal ledgers that stretch back more than a century. These materials reveal when individual properties first opened, how many rooms they added during boom periods, and which structures disappeared after storms or redevelopment projects. Researchers often start with a single postcard view from the 1910s, then cross-reference the visible buildings against tax rolls from the same decade to confirm ownership and capacity.
Photographic Sequences Reveal Physical Changes
Coastal communities began collecting systematic photographic surveys in the late nineteenth century, and those collections now serve as primary evidence of hospitality growth. A single stretch of beach might appear in images taken every five to ten years, allowing observers to count new hotels, note expansions of existing lodges, and identify when parking lots replaced earlier gardens or tennis courts. Local historical societies in several states have digitized portions of these collections, making it possible to align images by landmark rather than by date alone. One study that compared 1928 and 1955 photographs of a single New England inlet found that the number of visible lodging structures tripled while the footprint of each building increased by roughly forty percent.
Local Records Supply Dates, Ownership, and Capacity Data
Property tax assessments, building permits, and fire insurance maps supply the quantitative backbone that photographs alone cannot provide. These documents record the year a structure received its certificate of occupancy, the number of guest rooms listed on each application, and any subsequent additions approved by the planning board. When researchers merge permit data with contemporaneous photographs, they can distinguish between buildings that were enlarged and those that were replaced entirely. In one coastal county, ledgers from the 1930s showed that eight new boarding houses opened within eighteen months after a rail line reached the shore, yet only four of those structures appear in photographs from the same period because the others occupied side streets not captured by the main commercial photographer.
Combining Sources Across Decades
Archivists increasingly use geographic information systems to overlay successive photographic layers with parcel-level records. This method produces time-series maps that mark each hospitality property by opening date and square footage. The resulting visualizations show clusters of development that correspond to specific infrastructure projects, such as the arrival of electricity in 1912 or the paving of a coastal highway in 1936. Analysts have also incorporated ship passenger lists and hotel register summaries to estimate seasonal occupancy rates, which in turn help explain why certain properties added wings only after particular years. Data from the Library of Congress photographic collections have been matched with county deed books to confirm that several large resorts built between 1900 and 1915 changed hands multiple times before reaching their final size.
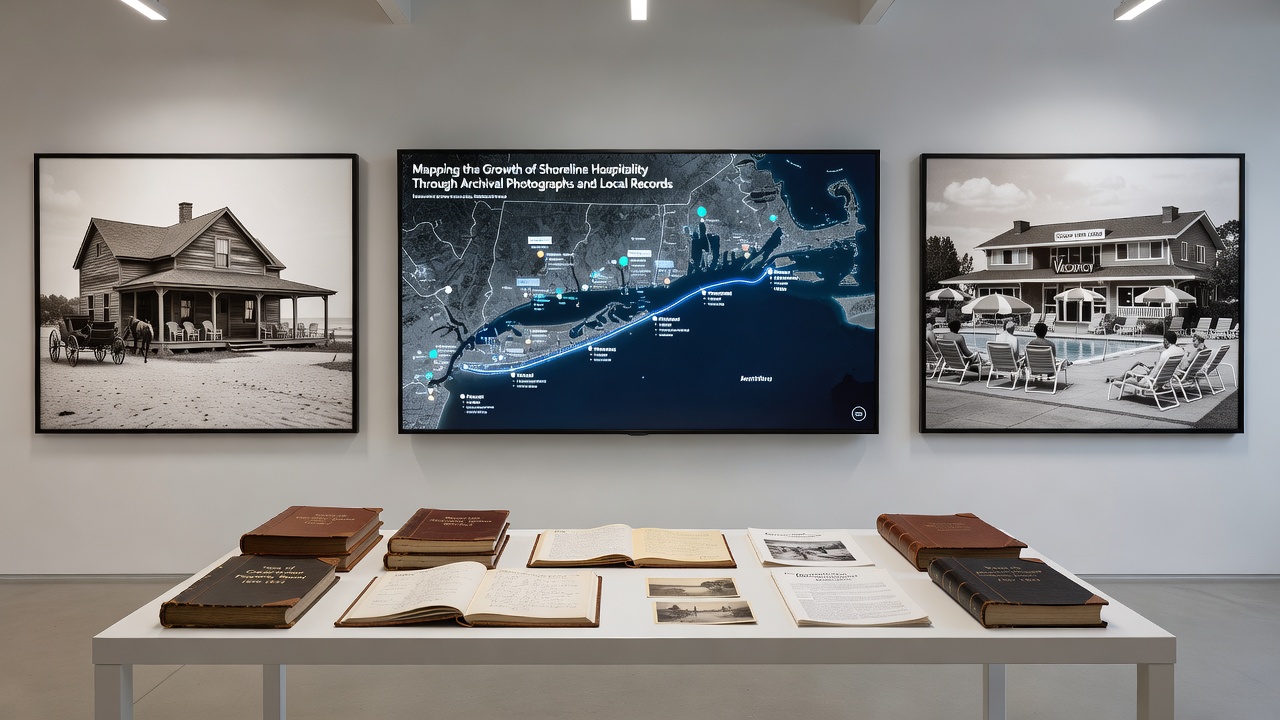
September 2026 will mark the scheduled release of a new statewide database that links digitized fire insurance maps from 1885 through 1960 with modern property records for every coastal county. The project, coordinated by state archives and university geography departments, will allow users to query any address and receive a timeline of hospitality-related permits and photographic references. Early test versions already demonstrate how many structures listed as hotels in 1940 had become condominium complexes by 1985, information that remained scattered across separate collections until the integration effort began.
Regional Variations in Documentation Quality
Documentation density varies by region because some municipalities maintained stricter building permit systems than others. In areas where records survived fires or floods, researchers can trace individual room additions year by year, whereas in jurisdictions with gaps the photographic record becomes the sole source for estimating size changes. Canadian provincial archives, for instance, retain complete sets of municipal assessment rolls that list guest-room counts for every licensed establishment, while comparable U.S. county records sometimes survive only in microfilm fragments. Analysts therefore weight the reliability of each data point according to the completeness of the surviving local ledger before drawing conclusions about overall growth rates.
Applications for Contemporary Planning
Planning departments now consult these historical maps when evaluating proposals for new shoreline construction. By understanding the sequence of past expansions, officials can identify zones where earlier development already altered dune systems or altered drainage patterns. The integrated datasets also support studies of how hospitality infrastructure responded to major events such as the 1938 hurricane or the 1962 Ash Wednesday storm. In each case, photographs taken immediately after the event show which properties reopened quickly and which sites remained vacant for decades, patterns that correlate with the speed of permit issuance recorded in local offices.
Conclusion
Archival photographs and local records together create a layered account of shoreline hospitality growth that neither source can produce alone. When researchers align dated images with permit ledgers and tax assessments, they obtain measurable evidence of when and where lodging capacity increased, how individual properties changed size, and which external events triggered new construction. The forthcoming statewide database scheduled for release in September 2026 will further standardize access to these combined materials, allowing consistent comparisons across counties and decades. The method remains grounded in primary documents rather than interpretive narrative, and its continued refinement depends on the preservation and digitization of the original photographs and ledgers still held in regional archives.